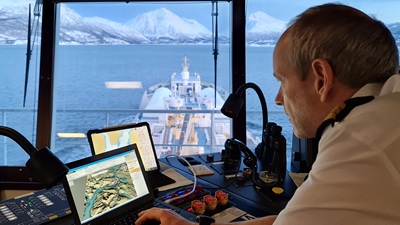
New digital tools will help make voyages even safer and more efficient in the future. Karl Helge Haagensen of the Norwegian Coastal Administration was recently the pilot on board M/T Tern Ocean through the narrow and shallow Tjeldsundet sound. Here the digital tool “S-100 Demonstrator”, with live updates from S-129, was tested on a commercial voyage – the world's first such test.
The aim of S-129 is to ensure good clearance in areas where depths are marginal.
Calculates where it is safe
S-129 uses models of a ship’s shape and physical structure in its calculations. Physical factors from the ship’s surroundings are also transferred to a model of the sailing area itself: factors such as the underwater terrain, currents, tide, wave height, wind, depth, the water’s salinity and barometric pressure.
An important objective for S-129 is to be able to extend the room for navigable manoeuvre.
Innovation is important for pilots
Pilotage has existed for hundreds of years and today’s pilots can still find their way safely without modern technical aids, through fog, rain or snow.
“Even so, innovation, research and development are important for improving safety at sea and the pilot service wishes to make an active contribution to this development,” says Erik Blom, Director of the Norwegian Coastal Administration’s pilot service.
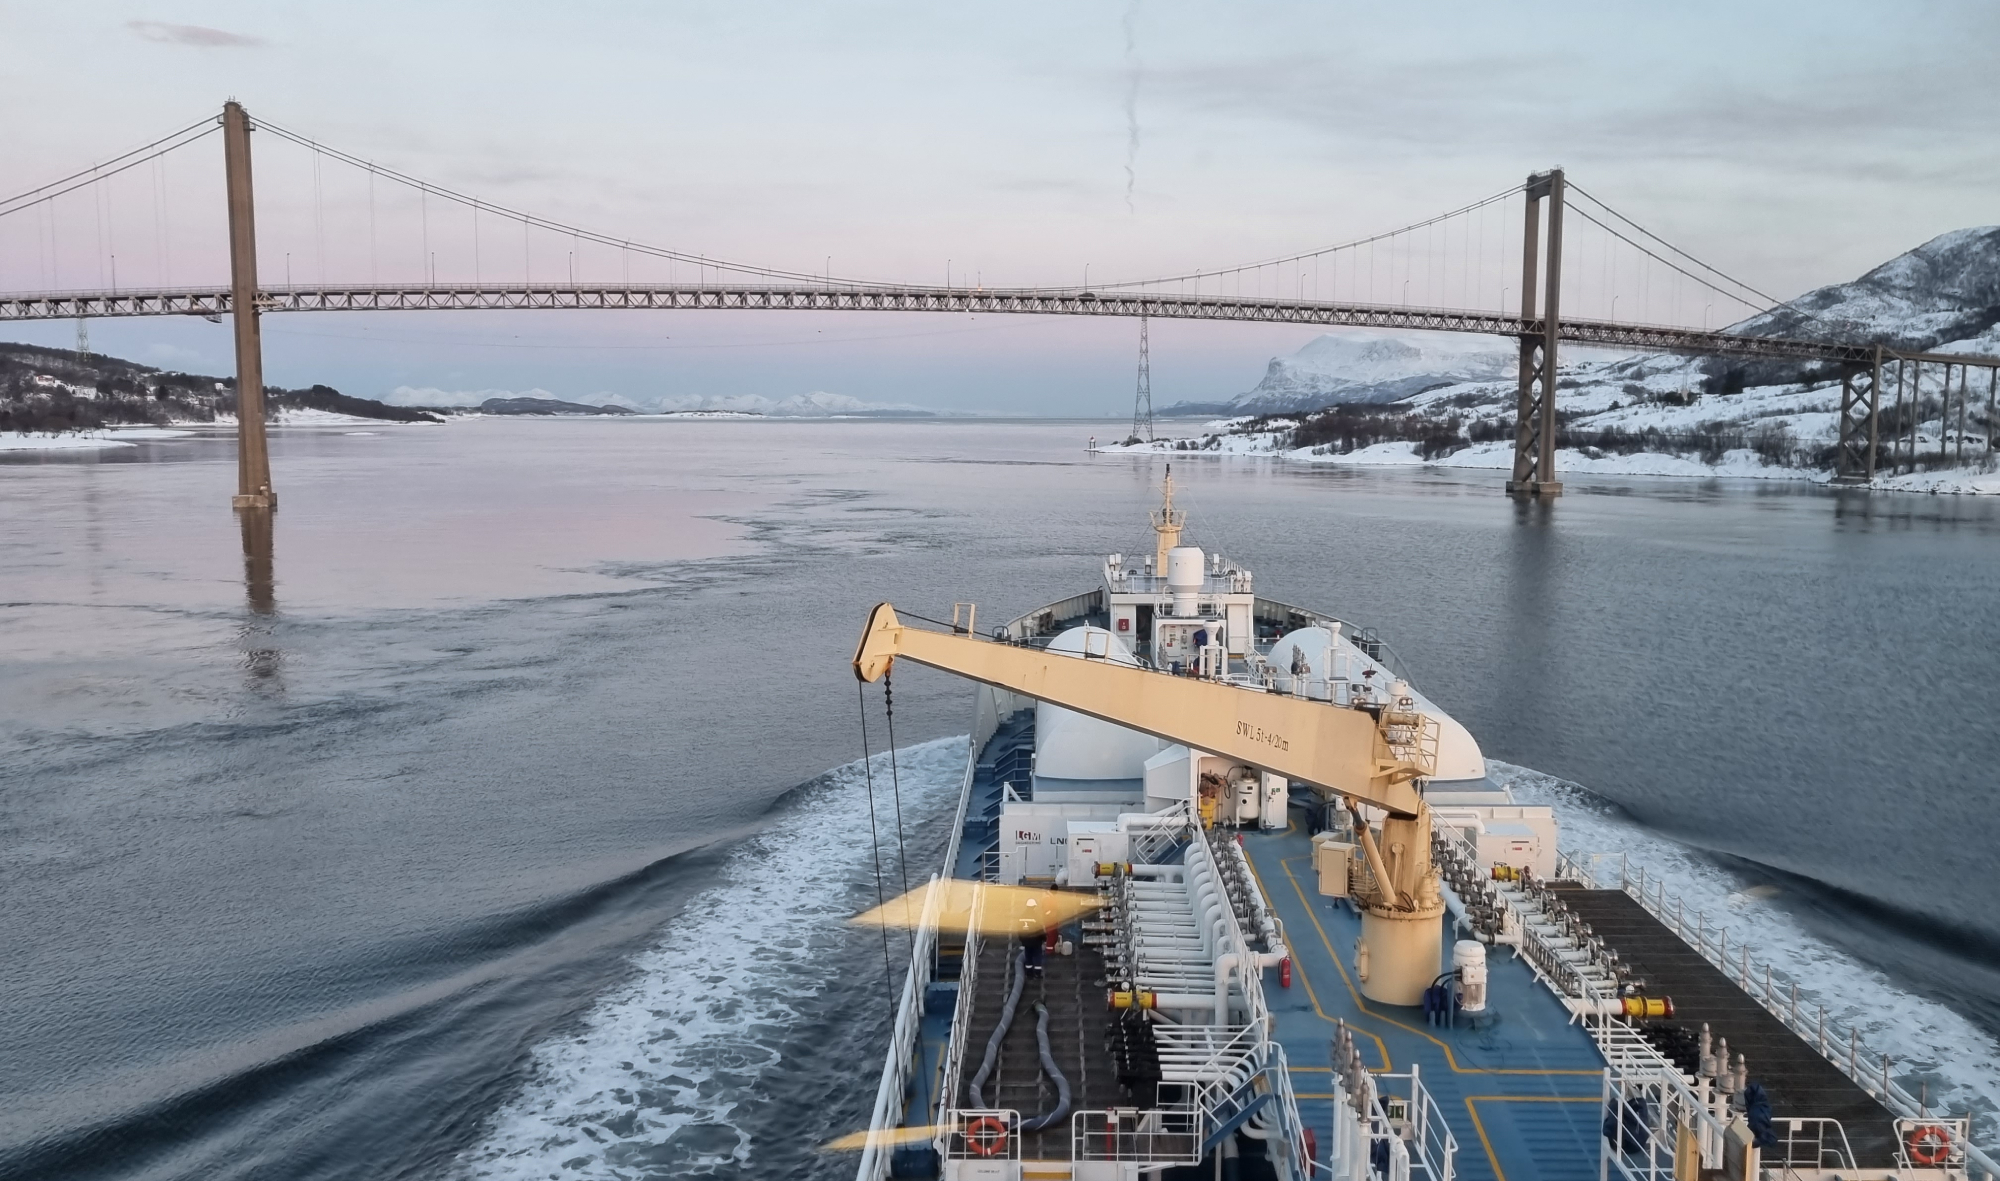
The test was performed when piloting M/T Tern Ocean through the narrow and shallow Tjeldsundet sound.
Can be documented in advance
“Strictly speaking, we did not need all this equipment on this voyage. Our aim was to test the new digital system and look at the interplay in practice. This is completely new and still under development. But when we get new tools that increase safety at sea, then this is obviously of tremendous value. Both the offshore and cruise fleets set stringent requirements for documentation of the clearance under the keel.”
“With S-129, we can do the calculations and plan the voyage in advance, to see whether the route can be sailed,” says pilot Karl Helge Haagensen.
Greater room for manoeuvre
“We can document safe sailing depths in advance. This means being able to sail as soon as the tide is high enough and save time by not having to wait for high tide. Ships can be loaded heavier, which means fewer trips, or they can choose shorter new routes and save fuel,” says pilot Karl Helge Haagensen.
Tailored to the vessel and area
“S-129 gives an extra layer of information that calculates and shows where it is safe to sail. Red areas on the chart show where it is not safe. This is all tailored to the specific ship and the specific waters. Information about the ship is used together with the external conditions that affect it, such as depth, currents and the tide, and everything is shown in the S-100 Demonstrator application,” says Svein Skjæveland, Project Manager at the Electronic Chart Centre (ECC).
“In this test in Tjeldsundet , we looked very specifically at depth, tide and surface currents,” he says. We were also able to drape information such as ENCs and seabed conditions over the depth data in the display of data in the Demonstrator.
Updated during the voyage
The company OMC International provides what is known as the under keel clearance services. During the voyage, AIS information is obtained about draught, position and speed. OMC uses this to calculate new S-129 datasets. Direct connection in the Demonstrator to OMC’s data flow ensures access to the new, adjusted dataset every other minute throughout the voyage, so that changes are shown continuously.
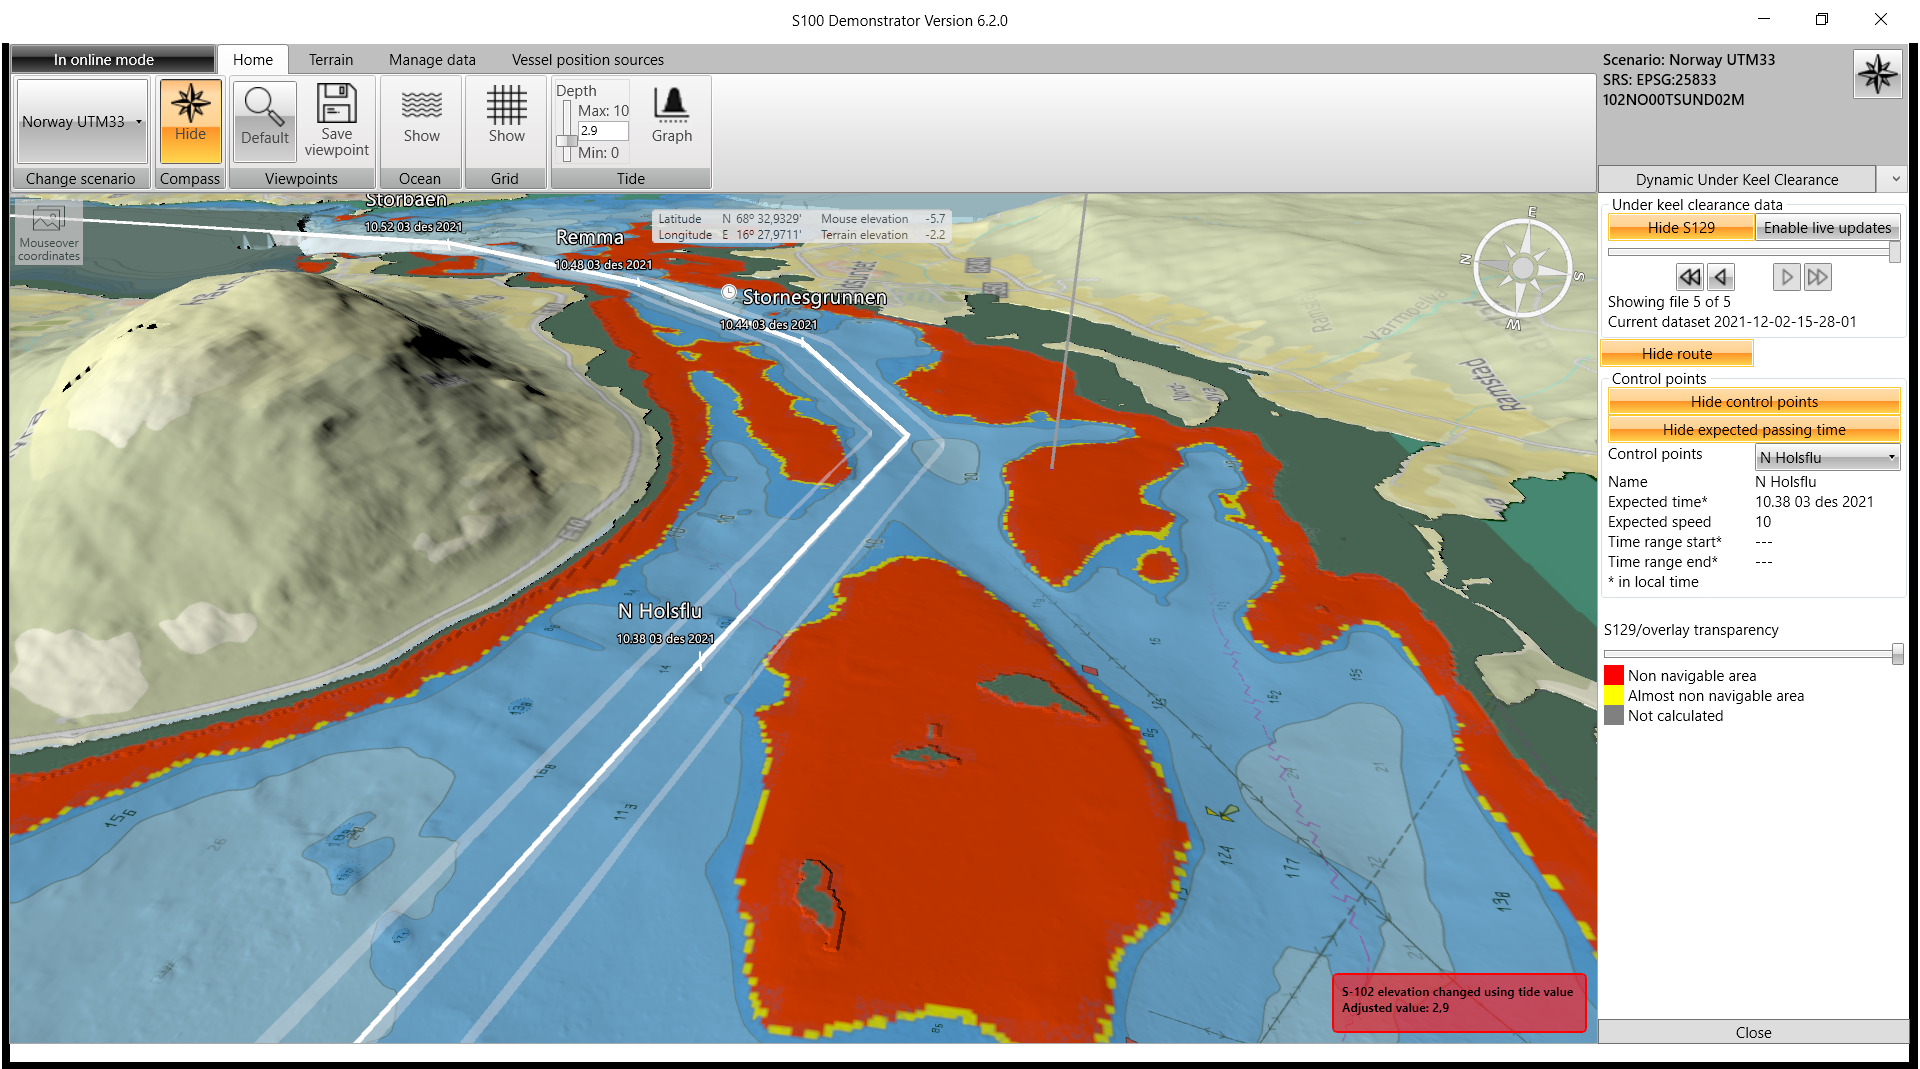
All data gathered into one image during the test in Tjeldsundet. Screen dump, S-100 Demonstrator.
Tested data flow in Tjeldsundet
The flow of data was tested in practice during the voyage through Tjeldsundet. Data from the producer can be directly downloaded from the end user system, in a safe and effective solution that ensures security and integrity in the data transfer process. At the moment, this is one of the few existing implementations of the security protocol that is described in S-100, so this is innovative and right at the forefront of development,” says Svein.
Tjeldsundet was a very suitable location for this particular test.
“It is relatively shallow here, which increases the hydrodynamic effect and makes the ship sit lower in the water (the squat effect as it is known). The currents are also demanding and the differences in high and low tides are also quite large up here in the north,” says Karl Helge.
Everything in one image
“Getting everything in one graphic image is a great advantage for the person navigating. Different data is obtained from different sources, but everything goes into S-100 Demonstrator as different layers, so that we see the total picture,” says Karl Helge, who also had three extra XR2 sensors from AD Navigation to ensure the precise position at all times.
“We used to have much of this information on different screens, but now we get it all in the same image. The big new thing is online communication with external parties, such as OMC, who supply continuous updates of the under keel clearance (UKC),” he says.
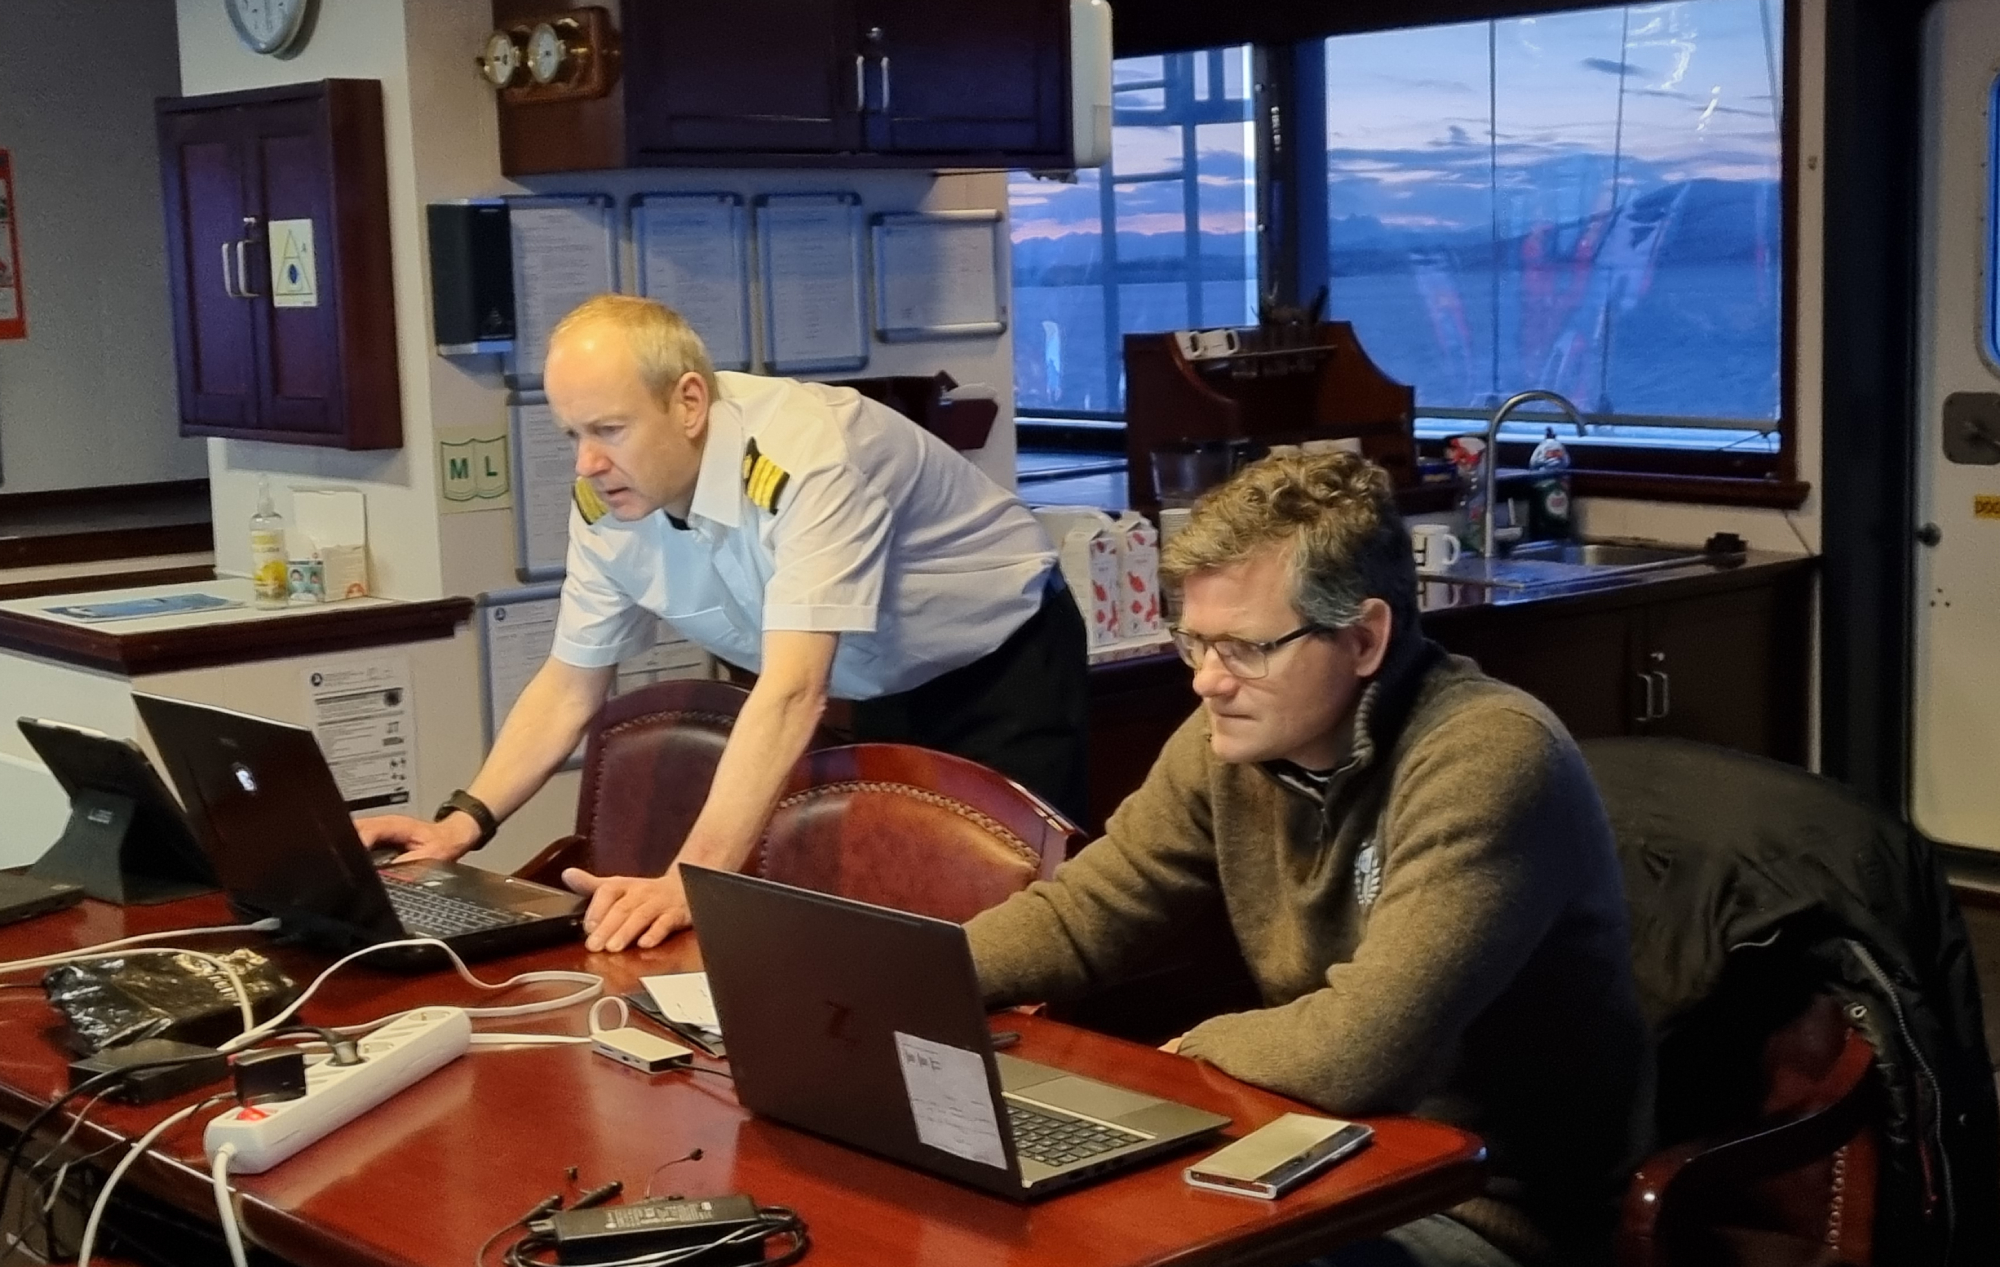
State pilot Karl Helge Haagensen of the Norwegian Coastal Administration and Svein Skjæveland of ECC at work during the test.
Saves time, money and the environment
Svein explains that the purpose is to show that it is possible to create data in these formats and use it in the S-100 Demonstrator, which is the main system for this development project.
“We want to show that this equipment can be used and see whether it provides advantages. Here, for example, there are opportunities for shipping companies to make voyages more efficient, by loading ships heavier or saving time by sailing different, shorter routes.
“The aim is to improve safety, make voyages more economical and obtain environmental benefits in the form of lower emissions because fuel consumption is reduced,” says Svein Skjæveland, project manager at the Electronic Chart Centre (ECC)